Stop Optimizing the Average. You’re Losing Millions.
In short
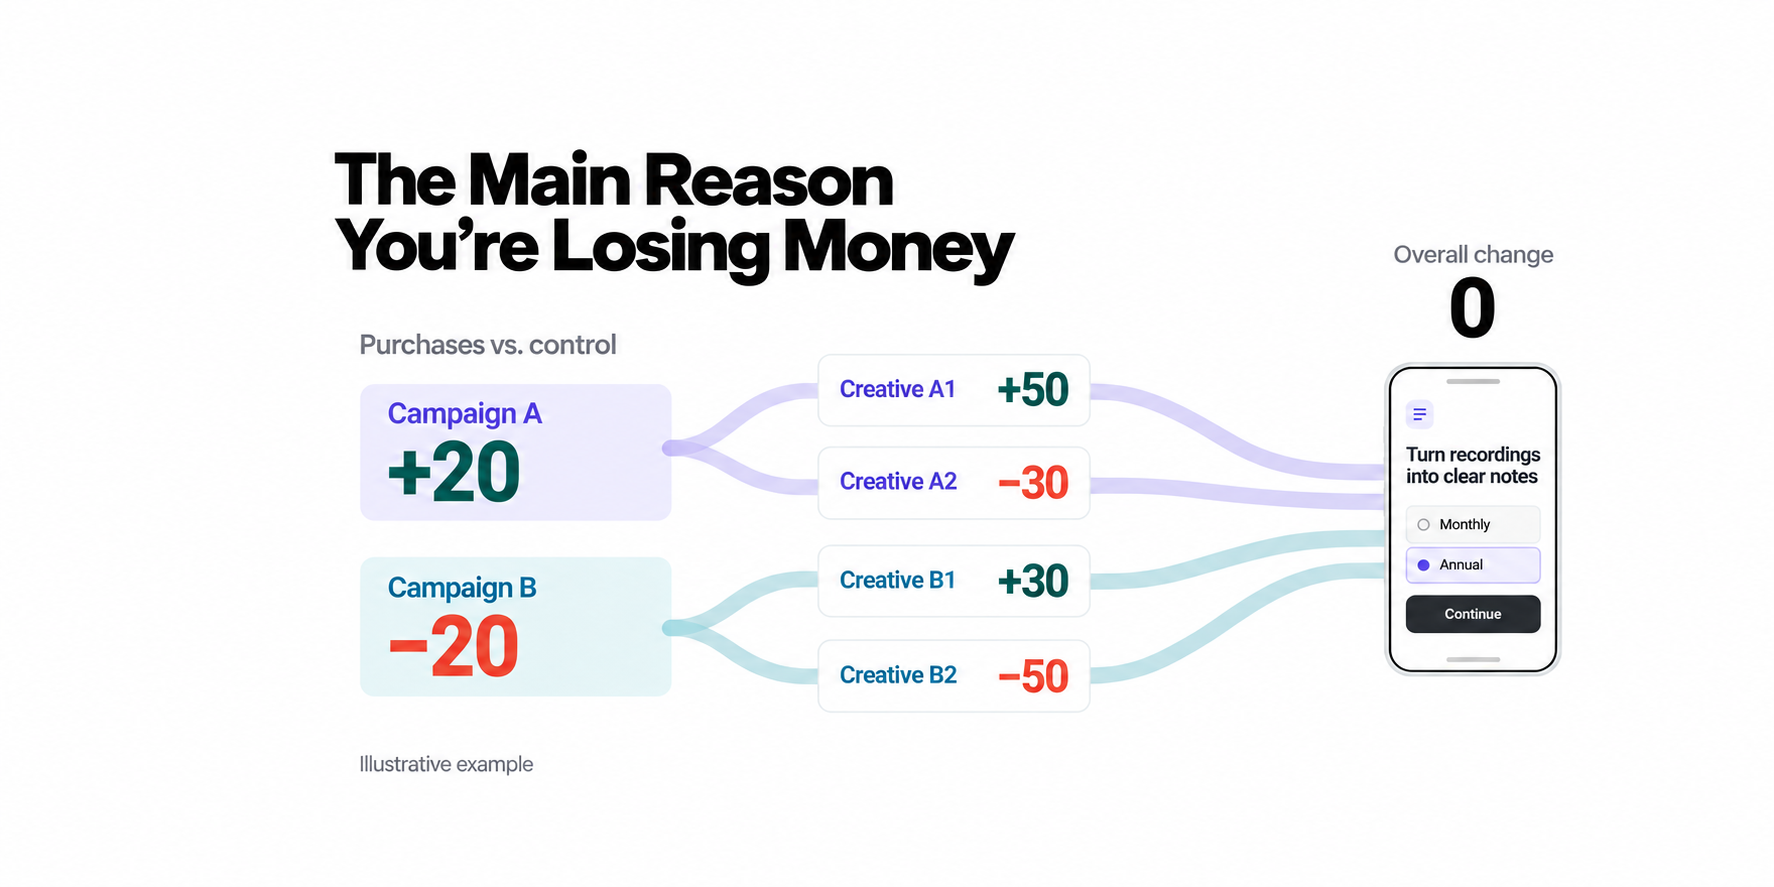
An experiment can look flat while it works for half the audience: the aggregate averages together people with different needs, and +20 and −20 purchases cancel each other out. Break each result down by campaign, creative and funnel step. Then personalize the journey for each audience and judge pricing by the pROAS forecast, not by conversion alone.
Take a note-taking app. It records speech and turns it into notes.
You run an experiment on the web funnel. The overall metrics stay the same.
Did you just waste time and money?
Look more closely, and you see that traffic came from different sources in equal shares:
- Campaign A: +20 purchases vs. control.
- Campaign B: −20 purchases vs. control.
The aggregate averages together people with different needs. It tells you nothing about the funnel itself. With equal traffic, +20 and −20 purchases cancel each other out.
The experiment improved conversion for half of the audience. And it would have been so easy to miss.
Ask yourself:
- How much money have I wasted because I couldn't see which campaigns needed to be turned off already?
- How much money have I wasted because I couldn't personalize the funnel for a specific segment?
- How much revenue have I missed because I didn't scale the successful variants?
- What would my pROAS look like if I could see forecasts for individual creatives?
1. Granularity = measurability = growth.
In this illustrative next iteration, pause A2 and B2 and split the same 4,000 starts between A1 and B1. If their conversion rates hold, purchases rise from 400 to 560—without changing another screen.
2. Let the system calculate.
10 campaigns with 10 creatives each = 100 sets of metrics. Analyzing all of this manually is practically impossible.
The system should:
- Calculate automatically: metrics by creative and funnel step, with confidence intervals.
- Identify losses: which screen, which segment, how much money.
- Understand the message: compare the meaning of the creative, the entry screen, and the funnel to find breaks in the promise.
- Suggest the next step: a draft experiment, not another dashboard.
3. Analyze every step, not just one number
Break the journey into steps: start → second screen → paywall → offer → payment → renewal.
For each creative, you can see where it loses people—and money.
- Drop-off on the first screen: the creative's promise and the funnel's entry don't match.
- Drop-off during the questions: the funnel isn't relevant to this person.
- Drop-off at the paywall after a normal journey: the offer or the price.
- Payments without renewals: the person hasn't started using the product, or the promise hasn't been fulfilled.
4. Questions to ask before making any change
- Who is this for?
- What exactly are we changing?
- How will we test it?
- How much will it cost?
- How long will it take?
- How much could we earn?
- How likely is it to work?
The first question has the biggest financial consequences. Who are the people behind the rows labeled “Campaign A,” “Campaign B,” “Creative 1,” and “Creative 2”?
A good system answers these questions for you.
5. People buy a way to meet a need, not features
A creative offers one such way. A click means “I'll try it.”
For the note-taking app:
- Creative 1 promises lecture notes.
- Creative 2 promises meeting follow-ups.
Each promise attracts different people:
- Lecture notes → a student preparing for an exam; someone taking a course to change careers.
- Meeting summaries → a manager tracking execution; an account manager recording agreements.
They have different needs, contexts, expectations, fears, and habits. They will behave very differently inside the same funnel.
A weak result from creative 2 doesn't mean these people don't need the product. Maybe they were shown a journey that wasn't meant for them?
6. Onboarding is a sales consultant, not a questionnaire
A consultant:
- Confirms that you'll find what you were promised.
- Clarifies your goal.
- Asks what they need to know to help you.
- Guides you toward what you came for.
- Provides evidence that your need will be met.
- Shows the result.
- Offers the purchase to those who are ready.
A quick test:
- Would a salesperson ask a student which team member should receive the meeting summary?
- Would they ask a manager which exam they're preparing for?
Now you have a choice: build a universal funnel that fails to show how the product addresses specific needs, or create a separate journey for each segment.
A modern system should understand your product's capabilities and work with any audience, personalizing both the ad creatives and the funnel they lead to.
7. Understand the audience before changing the funnel
You shouldn't have to guess who a creative will bring in.
Ideally, you design it for a specific audience—or at least check who it actually attracts:
- A creative about meeting summaries is designed for a manager.
- A creative about lecture notes is designed for a student.
A creative is a hypothesis about a person: their needs, context, fears, and expectations. Its job is to capture attention and make the need feel relevant now.
The funnel tests that hypothesis. It's the first place where people respond directly: which goal they choose, where they stop, whether they pay. To connect those responses to the source, every visit is tagged with its campaign and creative.
Now you can see that people brought in by the meeting creative answer and pay one way, while people from the lecture creative behave differently.
Identify the audiences you want to work with and personalize their journeys.
To identify which audience a user belongs to, two questions are often enough: “What do you need notes for?” and “What will you do with the result?”
Not every question belongs in the main funnel. Asking “What do you do for work?” when someone came for lecture notes interrupts their journey for the sake of your analytics. That can affect your metrics.
If research questions don't fit the journey, show them only to a randomly selected subset of users.
This gives you two groups of experiments:
- Research experiments: check who actually arrives and find signals that distinguish these people from everyone else.
- Metric optimization experiments: test what to change for the identified group—the promise, questions, evidence, or offer—and compare the results properly.
8. A consultant doesn't quote everyone the same price
The paywall shouldn't show everyone the same price list. It continues the conversation started by the creative:
- A student thinks twice about every $5.
- A manager is willing to pay for time saved.
One price for everyone is a poor compromise: too expensive for the student, suspiciously cheap for the manager.
When you know who has arrived, price becomes another experiment:
- Lower prices for students, to earn more through volume.
- Higher prices for managers, if they're willing to pay.
It's easy to get this wrong. A cheaper plan almost always wins on initial purchase conversion. It loses three months later, when half the subscribers haven't renewed. Payback takes several billing cycles, but the pricing and budget decision is needed now.
That's why pricing experiments can't be judged by conversion alone. They need to be judged by the forecast: how much a person from this group will bring in over a year relative to what it cost to acquire them—pROAS.
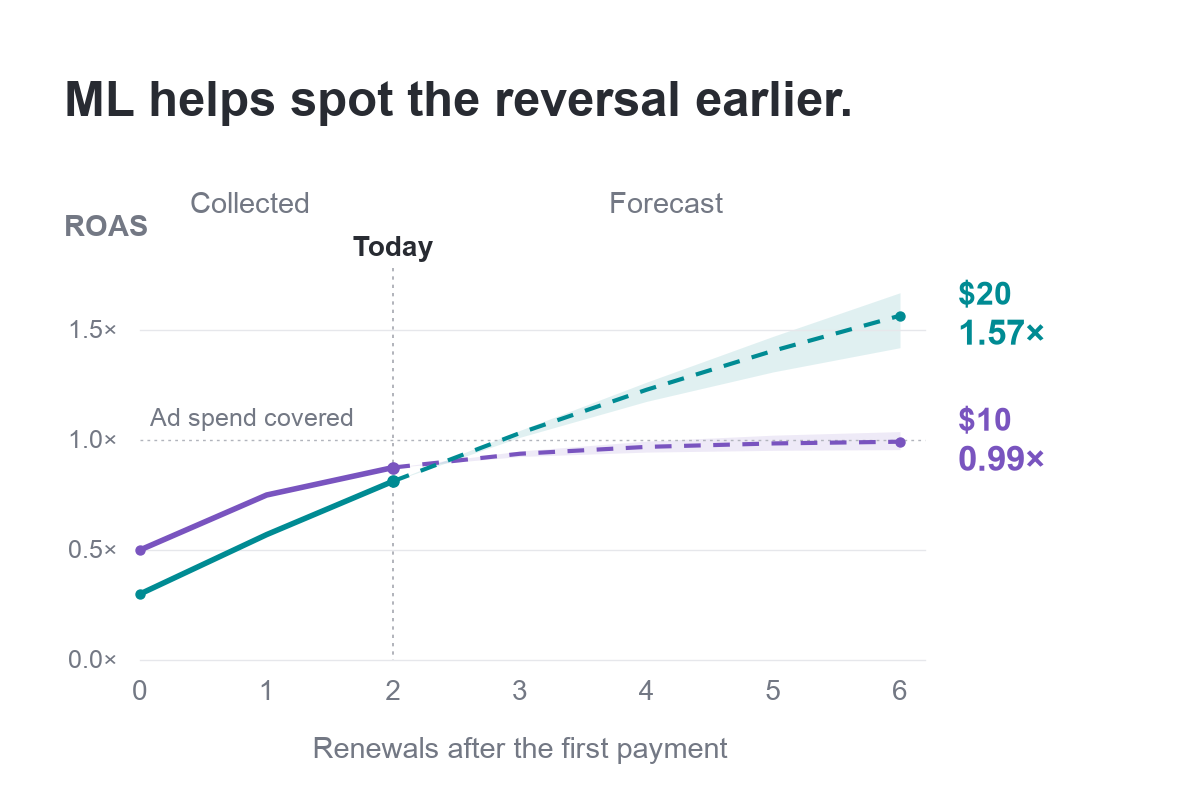
This is where ML comes in. The model learns from your product's renewals:
- It looks at the share of subscribers who renew for the first and second time, then uses those rates to project a full year—a Bayesian retention model.
- A young cohort with few renewals of its own borrows from project-wide history until it has enough data.
- It produces a range rather than a single number: pessimistic, central, and optimistic.
- It's tested against the past: the forecast is recalculated as if today were an earlier date, then compared with what happened afterward. A live forecast is recorded on the day it's made and isn't rewritten.
Make decisions using the edges of the forecast range:
- Even the optimistic scenario doesn't cover the cost → turn it off.
- Even the pessimistic scenario covers the cost → scale.
- In between → keep watching.
- For a young cohort → “too early,” with a date to check again.
There are two different reasons to turn something off:
- People buy at an above-average rate, but acquisition is too expensive → relaunch the same creatives with lower-cost traffic.
- People drop off at every step → the hypothesis about the person wasn't supported.
For pricing, the same process evaluates different sets of pricing options. Using the history of choices and renewals, it estimates how much each option could bring in for each audience and how likely it is to outperform the current price. This suggests what to test. The experiment provides the answer.
A good system does this for you:
- Collects audience data: source, answers, payments, and renewals.
- Finds segments that should be offered a different price.
- Designs and launches the experiment.
- Calculates pROAS for each variant and tells you when there's enough evidence to decide.
Alongside the forecast, you should see the amount of data, revenue already collected, and the payback period. Trust in the model should reflect how accurate it has been—and that track record should be visible.
9. The result
The experiment at the beginning of this article was successful for 50% of the audience. The question is whether you can detect that and create a separate funnel for the remaining 50%.
Check your own setup. Take your latest experiment and answer:
- Can you break down its result by campaign and creative?
- Can you see where in the funnel each creative loses people?
- Do you know who each creative was designed for and who actually arrived?
- Do you assess payback using validated data, or are you hoping for the best?
Every “no” is a place where money slips away unnoticed. Start there—on your own or with Segmently.
Key takeaways
- The aggregate averages together people with different needs: with equal traffic, +20 and −20 purchases cancel each other out.
- Break each result down by campaign, creative and funnel step to see where each creative loses people, and money.
- A creative is a hypothesis about a person, and the funnel tests it. Identify the audiences you want to work with and personalize their journeys.
- Judge pricing experiments by the pROAS forecast, not by initial purchase conversion: a cheaper plan almost always wins on conversion.
- Decide on the edges of the forecast range: if even the optimistic scenario doesn’t cover the cost, turn it off; if even the pessimistic one covers it, scale.